Introduction to STEM Statistics
STEM is the interaction between science, technology, engineering, and mathematics that results in so much more than each part taken on its own. STEM education has a national and global impact, so let’s review these using key STEM statistics.
When a concept has such a far-reaching impact on our day-to-day lives, it is undeniably important to examine that impact. We’ve combed through the research on STEM in an attempt to better understand the meaning of STEM, how it is impacting the world we live in right now, and what effect it will have on our future.
You can use the STEM statistics below to understand the state of STEM education.
Highlights of STEM Statistics
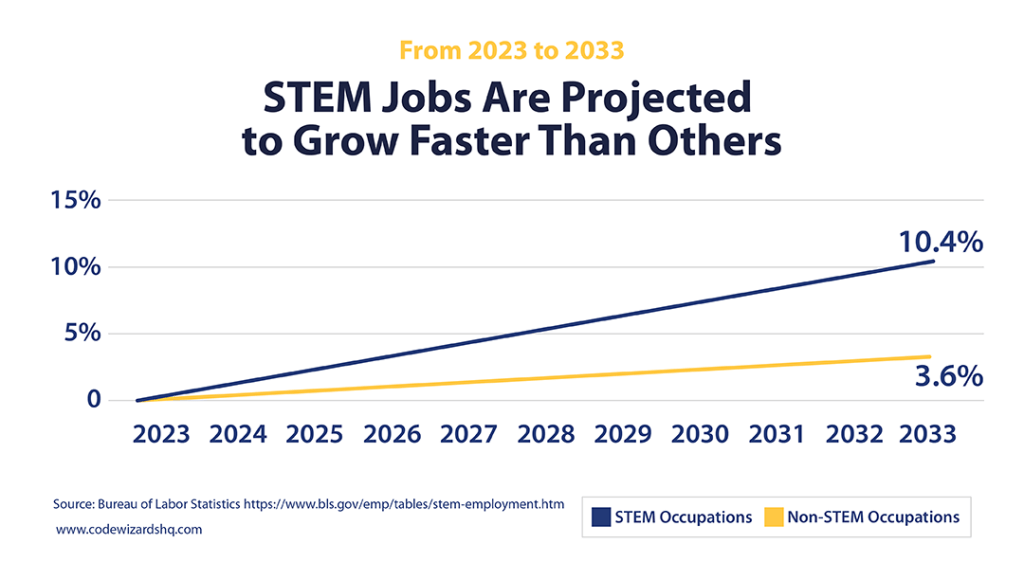
- STEM jobs are projected to grow 10.4% between 2023 and 2033, almost 3x faster than non-STEM jobs.
- The U.S. will need to fill about 3.5 million jobs by 2025, but 2 million may be unfilled due to a skills gap.
- STEM workers earn more. The median annual wage for all STEM occupations is $101,650 compared with $46,680 for non-STEM jobs.
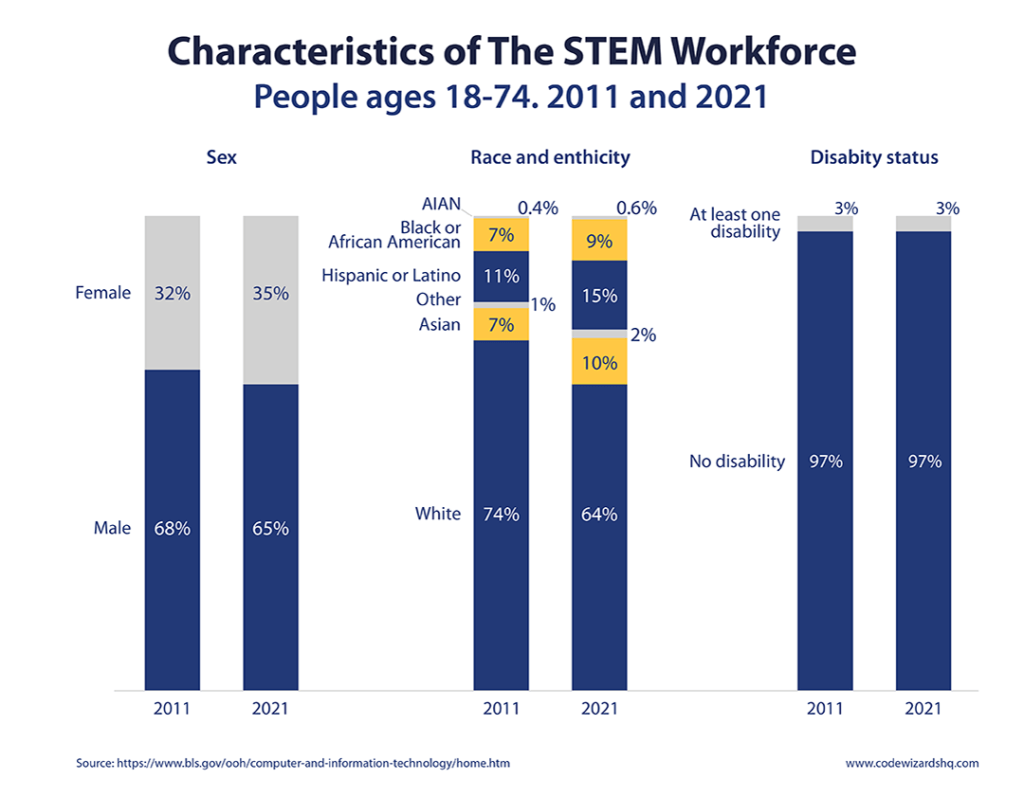
- Women remain underrepresented in STEM occupations, 65% of those employed in STEM occupations were men and about 35% were women between 2011-2021.
- Minorities also remain underrepresented. Blacks represent 11% of all jobs and 9% of STEM jobs. Hispanics represent 17% of all jobs and only 8% of STEM jobs.
- We may be falling behind in STEM education, only 20% of high school graduates are prepared for college-level coursework in STEM majors.
STEM Employment Statistics
This is a selection of statistics on the ways that STEM is impacting the global workforce as a whole. The general consensus? STEM jobs not only pay better than non-STEM jobs, but are also predicted to become increasingly important to the global economy over time.
- STEM jobs are projected to grow 10.4% between 2023 and 2033, compared to 3.6% in non-STEM jobs. (Bureau of Labor Statistics, 2024)
- The median annual wage for all STEM occupations is $101,650 compared with $46,680 for non-STEM jobs. (Bureau of Labor Statistics, 2023)
- Software development employment is projected to grow 17% from 2023-2033. (Bureau of Labor Statistics, 2023)
- A typical STEM worker earns two-thirds more than those employed in other fields. (Pew Research Center, 2018)
- 2 out of 5 Americans believe the STEM worker shortage is at crisis levels. (Emerson, 2018)
- Students today are twice as likely to study STEM fields compared to their parents, but the number of roles requiring STEM expertise is growing at a rate that exceeds current workforce capacity. (Emerson, 2018)
- The U.S. will need to fill about 3.5 million jobs by 2025; yet as many as 2 million may go unfilled due to the skills gap. (Emerson, 2018)
- Among those with some college education, the typical full-time, year-round STEM worker earns $54,745 while a similarly educated non-STEM worker earns $40,505, or 26% less. (Pew Research Center, 2018)
- Since 1990 STEM employment has grown 79% (from 9.7 million to 17.3 million), whereas overall employment grew only 34%. (Pew Research Center, 2018)
- 76% of parents want their child to end up in a STEM-related career. (Toy Association, 2017)
- Roughly 50% of students in a STEM bachelor’s degree program fail to earn these degrees 4 to 6 years after their initial enrollment. (NAP, 2016)
- A computer science major can earn 40% more than other college majors. Their lifetime earnings is $1.67M, compared to $1.19M for other college graduates. (Code.org)
Women in STEM Statistics
These statistics examine women in STEM-focused careers. Many studies throughout the years suggest that even though there is no significant difference in STEM-focused abilities between men and women, women are far underrepresented in high-paying positions in STEM fields. This is despite the fact that, on average, companies with women in leadership roles perform better than companies without.
Global Statistics for Women in STEM
- Globally, women comprise only 29.2% of the STEM workforce in 146 nations evaluated, compared to nearly 50% of non-STEM occupations. (Society of Women Engineers, 2023)
- By 2022, large global tech firms are predicted to have nearly 33% women representation in their workforce. (Deloitte, 2019)
- Only 29.3%, less than one-third, of those employed in scientific research and development (R&D) are women. (UNESCO, 2019)
- Companies with more women on their boards outperformed rivals by 42% higher return in sales, 66% higher return on invested capital, and 53% higher return on equity. (Women on Boards, 2011)
US Women in STEM Statistics
- Between 2007 and 2020, women held 25% of computing-related roles. (Builtin, 2023)
- In the academic year of 2020/21, about 860,760 male and 1.2 million female students earned a Bachelor’s degree in the United States. (Statista, 2023)
- In 2023, the gender gap in STEM remains significant with women making up only 28% of the STEM workforce. (MIT, 2023)
- The number of S&E degrees earned by women between 2011 and 2020 increased by 63% at the associate’s level, 34% at the bachelor’s level, 45% at the master’s degree level, and 18% at the doctorate level. (National Science Foundation, 2023)
- Despite accounting for over half of the college-educated workforce, women in the United States made up only 26% of computer and mathematical scientists, and 16% of engineers in 2019. (National Science Foundation, 2022)
- Women are underrepresented in software engineering, only 15% of software engineers in the U.S. are women. (Forbes, 2022)
- Women remain underrepresented in STEM occupations, two-thirds (65%) of those employed in STEM occupations were men and about one-third (35%) were women. (National Science Foundation, 2022)
- Between 2011 and 2021, the number of women in the STEM workforce increased 31%, from 9.4 million to 12.3 million. (National Science Foundation, 2022)
- Women earned a majority of all bachelor’s, master’s and doctorate degrees awarded to U.S. citizens and permanent residents in the 2017-2018 school year. They accounted for 53% of degrees in STEM fields at the bachelor’s level and 48% at the research doctoral level. (Pew Research Center, 2021)
- Nearly two-thirds (65%) of women working in STEM jobs in 2021 had at least a bachelor’s degree education, compared with less than half (43%) of men in STEM jobs. (National Science Foundation, 2021)
- Women in science and technology jobs are 45% more likely to leave the industry just within a year compared to their men counterparts. (Mandlabs, 2020)
- The percentage of women who hold the CIO or CTO role rose from 16% last year to 18% this year. (Korn Ferry, 2019)
- 63% of middle school girls who know women in STEM enjoyed STEM related subjects. (Microsoft, 2018)
- Less than 50 percent of parents say their daughter is encouraged to pursue a STEM career. (Emerson, 2018)
- Women receive a premium for working in STEM, 105% higher (approximately 2x) the earnings of women in non-STEM. (Rand, 2018)
- Women are more likely than men to work in the “STEM periphery”, roles in which they can apply STEM skills and expertise, but which are lower-paying jobs outside of traditional STEM occupations. (Rand, 2018)
- In 2018, women in computer, engineering, and science occupations were paid an estimated 80.7% of men’s annual median earnings. (Commerce.gov, 2018)
- Women comprise three-quarters of health care practitioners and technicians, the largest occupational cluster classified as STEM in this analysis, with 9.0 million workers – 6.7 million of whom are women. (Pew Research Center, 2018)
- Women remain underrepresented in engineering (14%), computer (25%) and physical science (39%) occupations. (Pew Research Center, 2018)
Minorities in STEM Statistics
These are statistics looking specifically at the relationships between STEM and minority groups. In general, we can see that despite diversity in a company being extremely beneficial for both its profits and its resiliency, minorities are still vastly underrepresented in STEM fields. This is likely caused by a number of factors, but one of the most obvious causes is the lack of funding for schools with larger minority populations.
“Diversity is America’s unique advantage in science and technology”
NSF Director Sethuraman Panchanathan.
- Collectively, Hispanic, Black, American Indian, and Alaska Native people made up 31% of the U.S. population, but 24% of the STEM workforce in 2021. (National Science Foundation, 2023)
- Unemployment rates in 2021 for STEM workers who were Black (6.6%) and Hispanic (5.7%) were higher than for white (2.9%) and Asian (2.3%) workers. (National Science Foundation, 2023)
- Among workers with at least one disability, 21% worked in STEM occupations in 2021, and 3% of the STEM workforce were people with disabilities. (National Science Foundation, 2023)
- Women of color earn the smallest share of STEM degrees. In 2020-21, women of color earned a small percentage (16.3%) of bachelor’s degrees across all STEM fields. (National Center on Educational Statistics, 2022)
- The underrepresentation of Blacks is evident across all STEM job clusters, with one exception: 11% of health care practitioners and technicians are black, equal to the share of blacks in the total workforce. (Pew Research Center, 2021)
- Blacks represent 11% of all jobs and 9% of STEM jobs. Hispanics represent 17% of all jobs and only 8% of STEM jobs. Blacks and Hispanics are underrepresented in the STEM workforce relative to their shares in the U.S. workforce as a whole. (Pew Research Center, 2021)
- American Indians and Alaska Natives together made up less than 1% of the U.S. population and STEM workforce in 2021. (National Science Foundation, 2021)
- More than a third of black (40%) and Latino (37%) students switch majors before earning a degree, compared with 29% of white STEM students (EAB, 2019)
- For every student enrolled, the average nonwhite school district receives $2,226 less than a white school district. (EdBuild)
- Nonwhite school districts get $23 billion less than white districts despite serving the same number of students. (EdBuild)
STEM in College Stats
These statistics are specifically dealing with STEM in higher education. The number of college students intending to major in science and engineering fields is steadily rising, as are the numbers of S&E graduates because of the many opportunities.
- Young adults with bachelor’s or higher degrees in the fields of science, technology, engineering, and mathematics (STEM) tend to have more positive economic outcomes, such as higher median earnings, than do those with degrees in non-STEM fields. (National Center on Educational Statistics, 2022)
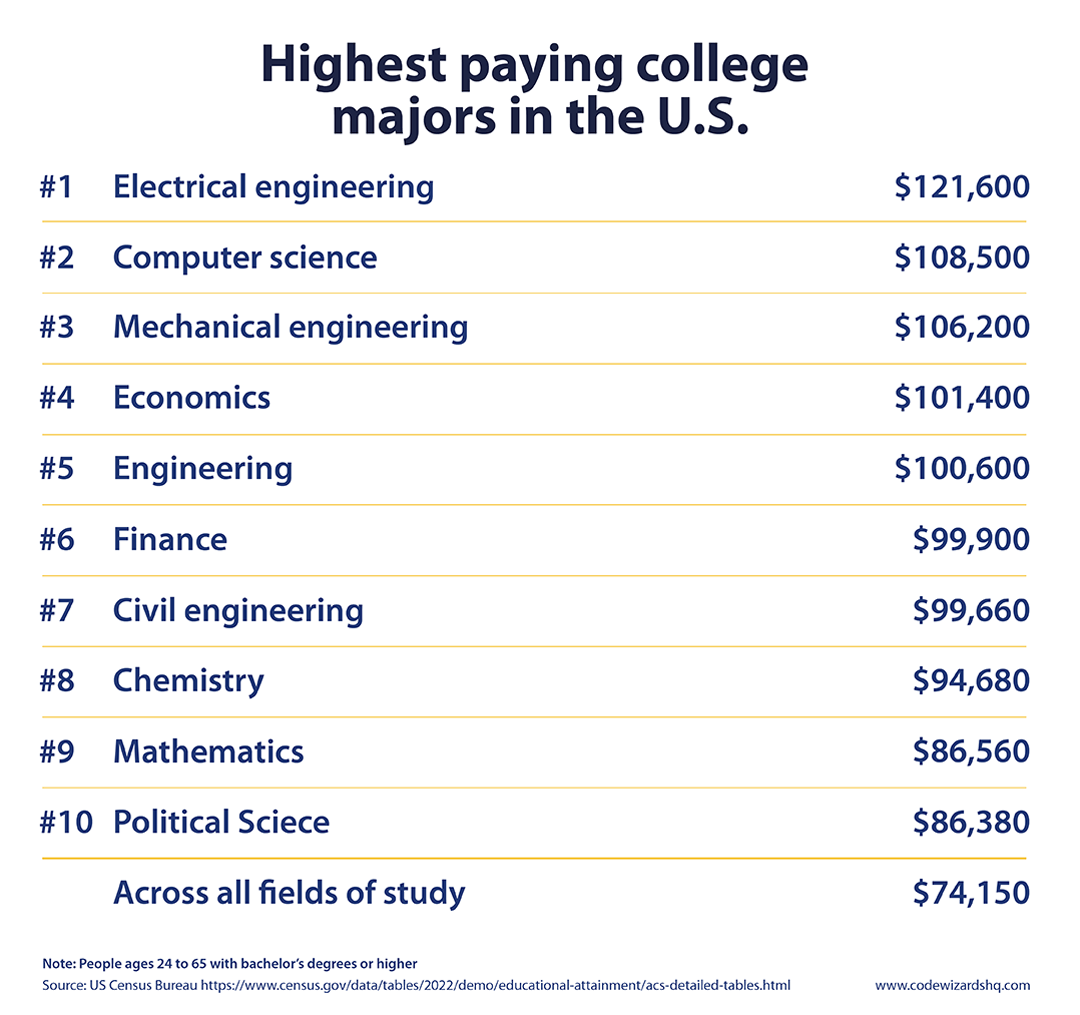
- The top 3 highest paying college majors in the US are STEM fields: electrical engineering, computer science, and mechanical engineering. (Census, 2023)
- Of the 2.1 million bachelor’s degrees conferred in 2020–21, about 146,573 (7%) were in STEM fields. (National Center on Educational Statistics, 2022)
- The vast majority (62%) of college-educated workers who majored in a STEM field were employed in non-STEM fields. (Census, 2021)
- 10% of STEM college graduates worked in STEM-related occupations such as health care. (Census, 2021)
- Some 36% of STEM workers have a bachelor’s degree but no graduate degree. (Pew Research Center, 2018)
- Roughly three-in-ten STEM workers (29%) have earned a master’s, doctorate or professional degree. (Pew Research Center, 2018)
- Life scientists are the most highly educated among STEM workers, with 54%, on average, having an advanced degree. (Pew Research Center, 2018)
- 72% of students majoring in computer science have a full-time job less than six months after graduating. (Forbes, 2016)
STEM Statistics for K-12 Education
These statistics are specifically dealing with STEM in education, with a focus on K-12 school years. The general consensus is that despite there being a need for more and better STEM education, teachers lack the necessary resources, both financial and experiential, to successfully achieve those results.
- 60% of public high schools offer at least one foundational computer science course. (Code.org, 2024)
- In the past year, 6.4% of high school students enrolled in foundational computer science classes. (Code.org, 2024)
- The percentage of high school graduates meeting the ACT readiness benchmark dropped from 19% to 16% in STEM (combined mathematics and science performance) in 2021-2022. (National Science Foundation, 2022)
- The US placed 34th of 80 countries in math, and 16th in science on the Programme for International Student Assessment (PISA). (OECD, 2022)
- Only 20% of high school graduates are prepared for college-level coursework in STEM majors. (Harvard Gazette, 2021)
- As of 2019, only 24 percent of 12th-grade students scored at or above the proficient level on the NAEP math assessment. (NAEP, 2019)
- The survey found only 1 in 3 adults (33 percent) believe teachers currently have the resources they need to provide a quality STEM education. (Emerson, 2018)
- Only 16 percent of high school seniors are keen on pursuing STEM careers. (Mandlabs, 2016)
- 50 percent of male high school graduates said that mathematics was one of their favorite subjects, compared to 43 percent of female high school graduates. (National Center on Educational Statistics, 2015)
- Compared to males, higher percentages of females earned credits in algebra II, precalculus, advanced biology, chemistry, and health science/technologies. However, higher percentages of males earned credits in physics, engineering, engineering/science technologies, and computer/information science. (National Center on Educational Statistics, 2015)
STEM in Early Education Stats
These statistics are specifically dealing with STEM in education, with a focus on the years before age 8. There is a consensus that it is important to begin STEM learning early, since an early understanding of STEM concepts is one of the best indicators of success in those fields in later years. It also supports a development of problem solving and critical thinking skills.
- Research says early learning in science and mathematics matters and supports the development of STEM-related habits of mind. (CADRE, 2018)
- As with learning a new language, children become fluent in STEM habits and more knowledgeable about STEM topics when they are immersed in them. (Joan Ganz Cooney Center, 2017)
- STEM support should start early. When the adults in a child’s life believe in and support a child’s STEM capacity, the child’s natural abilities are both acknowledged and then expanded (McClure et al. 2017)
- Children who engage in scientific activities from an early age develop positive attitudes toward science which also correlate with later science achievement and they are more likely to pursue STEM expertise and careers later on. (Joan Ganz Cooney Center, 2017)
- Young children are capable of engaging in, at developmentally appropriate levels, the scientific practices that high school students carry out. (Joan Ganz Cooney Center, 2017)
- Even in the first year of life, babies systematically test physical hypotheses when they see something that doesn’t conform to their expectations. (Joan Ganz Cooney Center, 2017)
- Early STEM instruction leads to better language and literacy outcomes. (Sarama et al. 2012)
- Research shows that among preschool-aged children, knowledge of math is a better predictor of later academic achievement than early reading or attention skills. (Duncan et al. 2007)
STEM Toys Stats
These are statistics relating to STEM-focused children’s toys and the effects they have. In general, parents feel that STEM-focused toys are extremely important to their childrens’ abilities in STEM subjects. The majority of parents also want their children to learn to code to some degree, but many feel unqualified to teach the necessary skills themselves.
- In 2024-2028, The STEM toys market value is set to grow by USD 8.09 billion, progressing at a CAGR of 8.89%. (Technavio, 2023)
- STEM toys that are designed for children to use at home were valued at USD 7.26 billion in 2018 and was the largest segment. (Technavio, 2023)
- Research indicates that parents still more frequently encourage sons to do STEM activities, including using STEM-themed toys, than daughters. This may subtly reinforce stereotypes about who can pursue STEM, and girls may also be missing out on important early learning experiences. (Geena Davis Institute, 2021)
- 67% of parents believe STEM/STEAM-focused toys are the primary way to encourage development of science, technology, engineering, and math in their child, followed by 57% saying at-home experiences. (Toy Association, 2019)
- The biggest challenge parents face in fostering STEM/STEAM skills is competition with screen time (50 percent), followed by time constraints (45 percent), and lack of fun learning options (39 percent). (Toy Association, 2019)
- Oral communication (60 percent), tech/computer literacy (58 percent), and mathematics (57 percent) topped parents’ lists of what kids should master and were pretty evenly rated. (Toy Association, 2019)
- Coding is a skill set parents would like their kids to acquire with 85 percent having encouraged or plan to encourage their child to learn to code. (Toy Association, 2019)
Recommended: Coding Toys for Kids
Start Building Your STEM Skills
These numbers give you an idea of the current state of STEM. STEM fields offer so much opportunity, especially for today’s kids. It benefits them to start learning and developing those important STEM skills early, but it’s also never too late.
Our coding classes for kids teach kids about STEM and naturally engages them in problem-solving, critical thinking, and logical reasoning. To start learning about STEM, view classes and enroll.